Tableau project write up

UNIQLO is a fast retailing brand and it is a Japanese casual wear designer, manufacturer and retailer. It entered the Chinese market in 2002, starting in Shanghai.
In this tableau project, the scenario is that the regional sales manager from Shanghai will have meeting with store manager from each store to analyze the weekly sales trend and plan effective strategies.
About UNIQLO: Uniqlo is one of the brands in Fast Retailing, a global company that operates multiple fashion brands. UNIQLO generates about 1.9 trillion Yen in annual revenue (FY 2019) from 2200 stores globally. UNIQLO provides high quality, performance, excellent customer services, with basic casual wear at a reasonable price.
This project aims to answer the following questions:#
- Which city generated the highest revenue? How did revenue in Shanghai compared to other regions(cities)?
- How many orders were placed online versus in store? Among those instore purchases, how many customers purchased on weekdays versus on weekend?
- What are the top selling products in Shanghai? What are the least selling products?
- Purchase pattern:
- Which age group purchased seasonal new items more?
- Gender and purchase preference
Analysis:#
In order to answer the above questions, I created 3 dashboards: sales dashboard, product performance and customer purchase behaviors.
1. Sales Dashboard:#
Making a good sales dashboard is important - it allows sales people to use the actionable sales data and make data driven decision quickly. Before I made this sales dashboard, I asked myself few questions:
- Who's is my audience?
- what sales KPIs do I want to see?
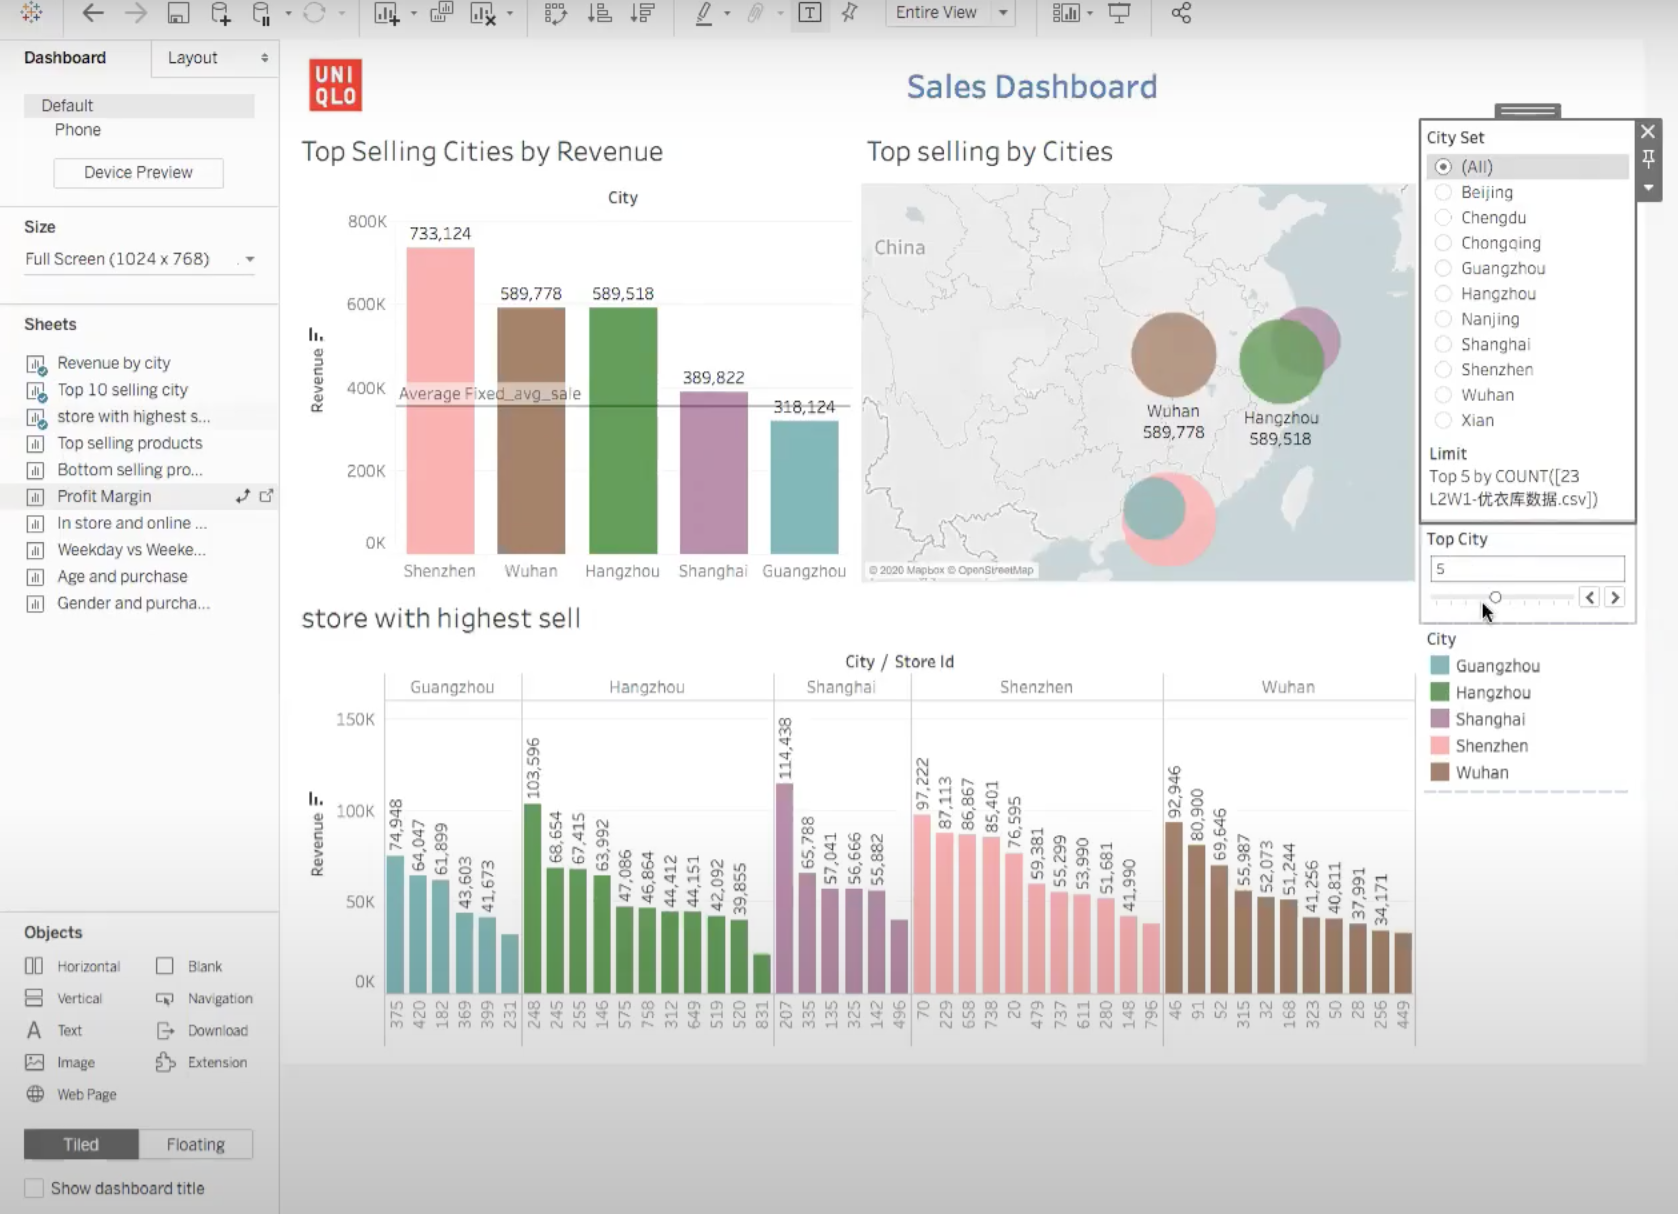
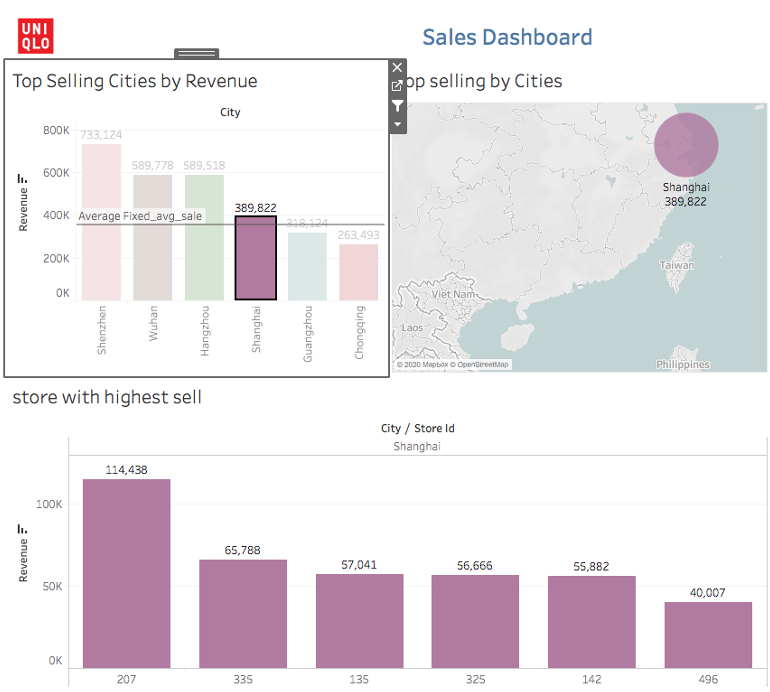
In this dashboard, I want my audience be able to select filters. For example, if the regional manager only wants to see the revenue of Shanghai, she can click “Shanghai” in the bar chart to see the values accordingly.
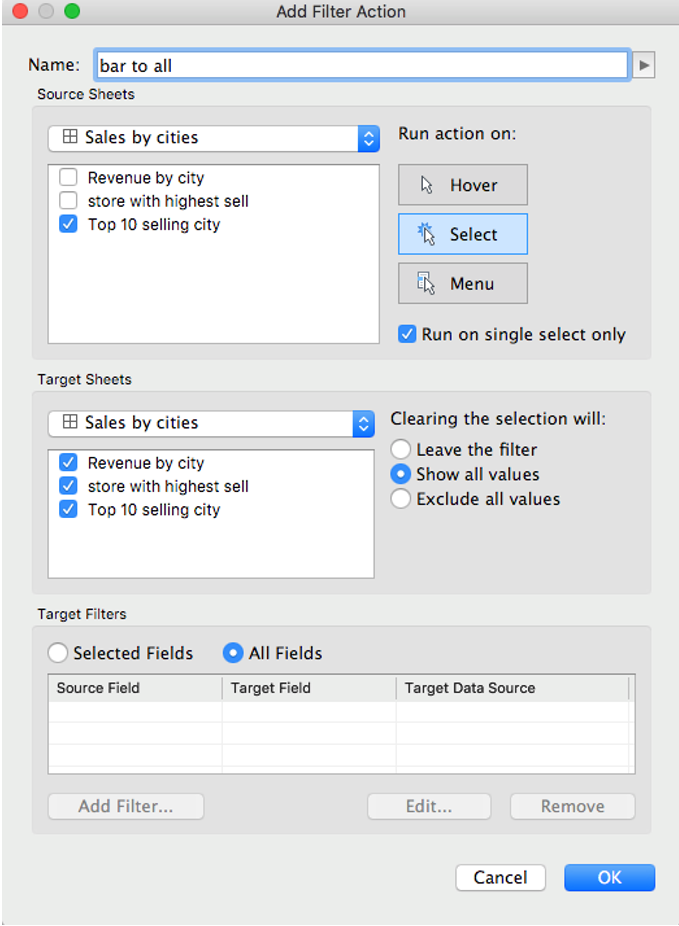
In order to do this, I created an action by clicking the “action” under the dashboard button. Then selected “Top 10 selling city” as source, and all the other sheets as target. By doing this, the action will be applied to all the sheets when selecting a specific city in the source sheet.
Challenge: fixed LOD:
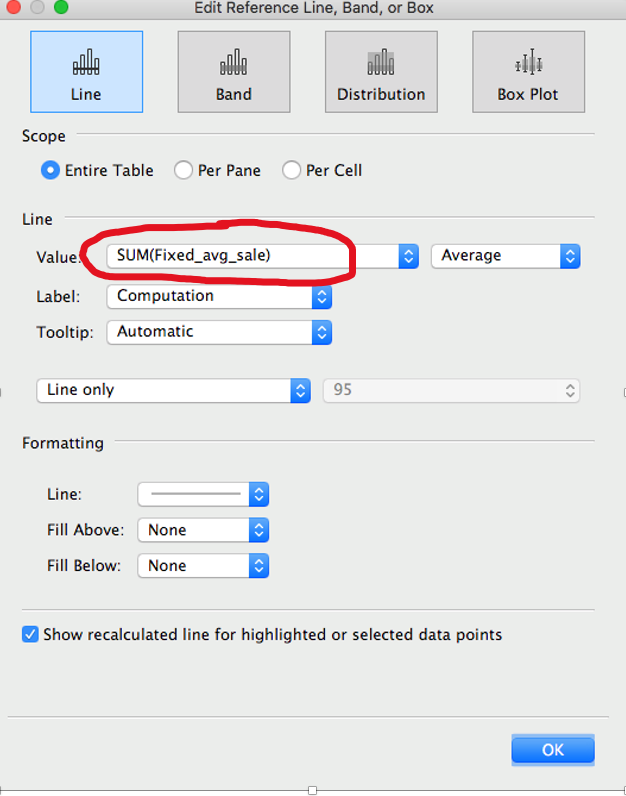
Another challenge encountered is to create a fixed level of details (LOD). In order to compare the revenue of each city to the average value, an average line needs to be added. This can be done by selecting the “Analytics” panel and drag an “Average Line”. However, by doing so, the average value will be recalculated if we adjust a filter. Therefore, we need a fixed average line.
Solution:
First, I create a calculated field and write the fixed calculation as {FIXED : SUM([Revenue]/10)}. This created a fixed average revenue across all 10 cities. After creating the LOD, add it as detail on the tableau worksheet. Drag an average line to the table, edit the value of the line to SUM(Fixed_avg_sale), the LOD we just created.
2. Product Performance Dashboard#
One of the goal of this project is to visualize the top or botton 5 selling products by quantity. The audience should be able to adjust the slider to show top/bottom products.
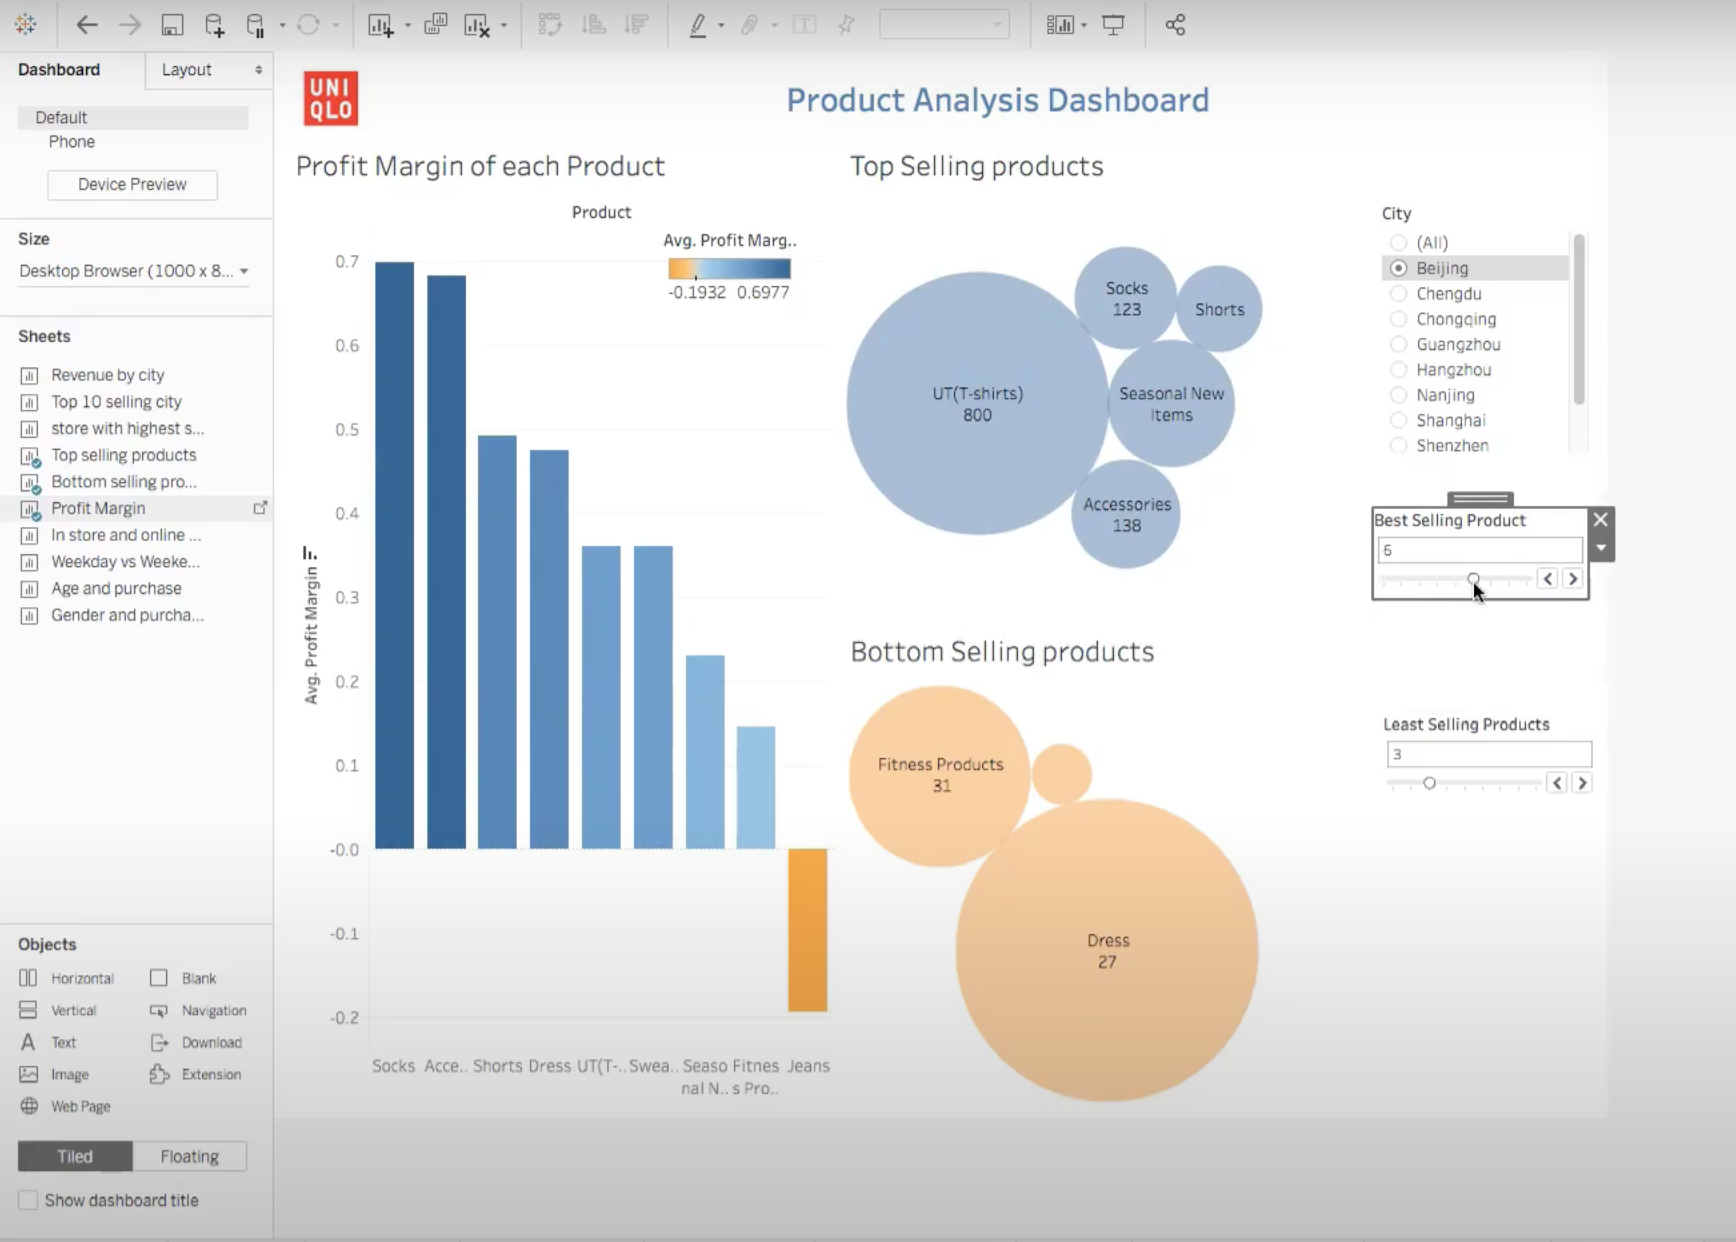
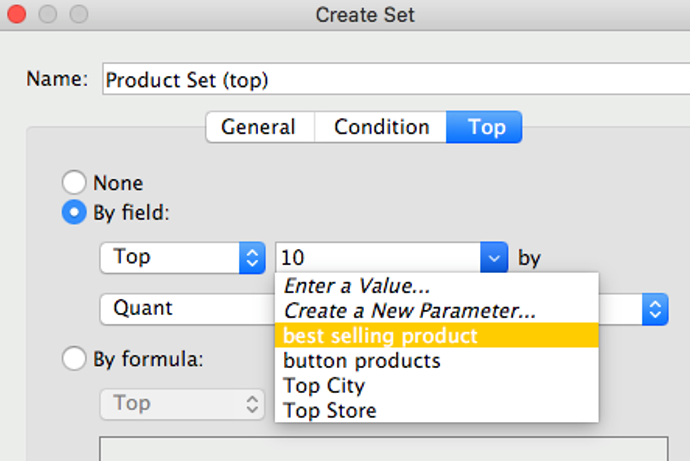
In order to achieve this, I created a parameter called “best selling product” and connected a set with the parameter. Now, by sliding the slider, the visualization shows the top 5 selling products in the bubble chart.
3. Customer Purchase Pattern#
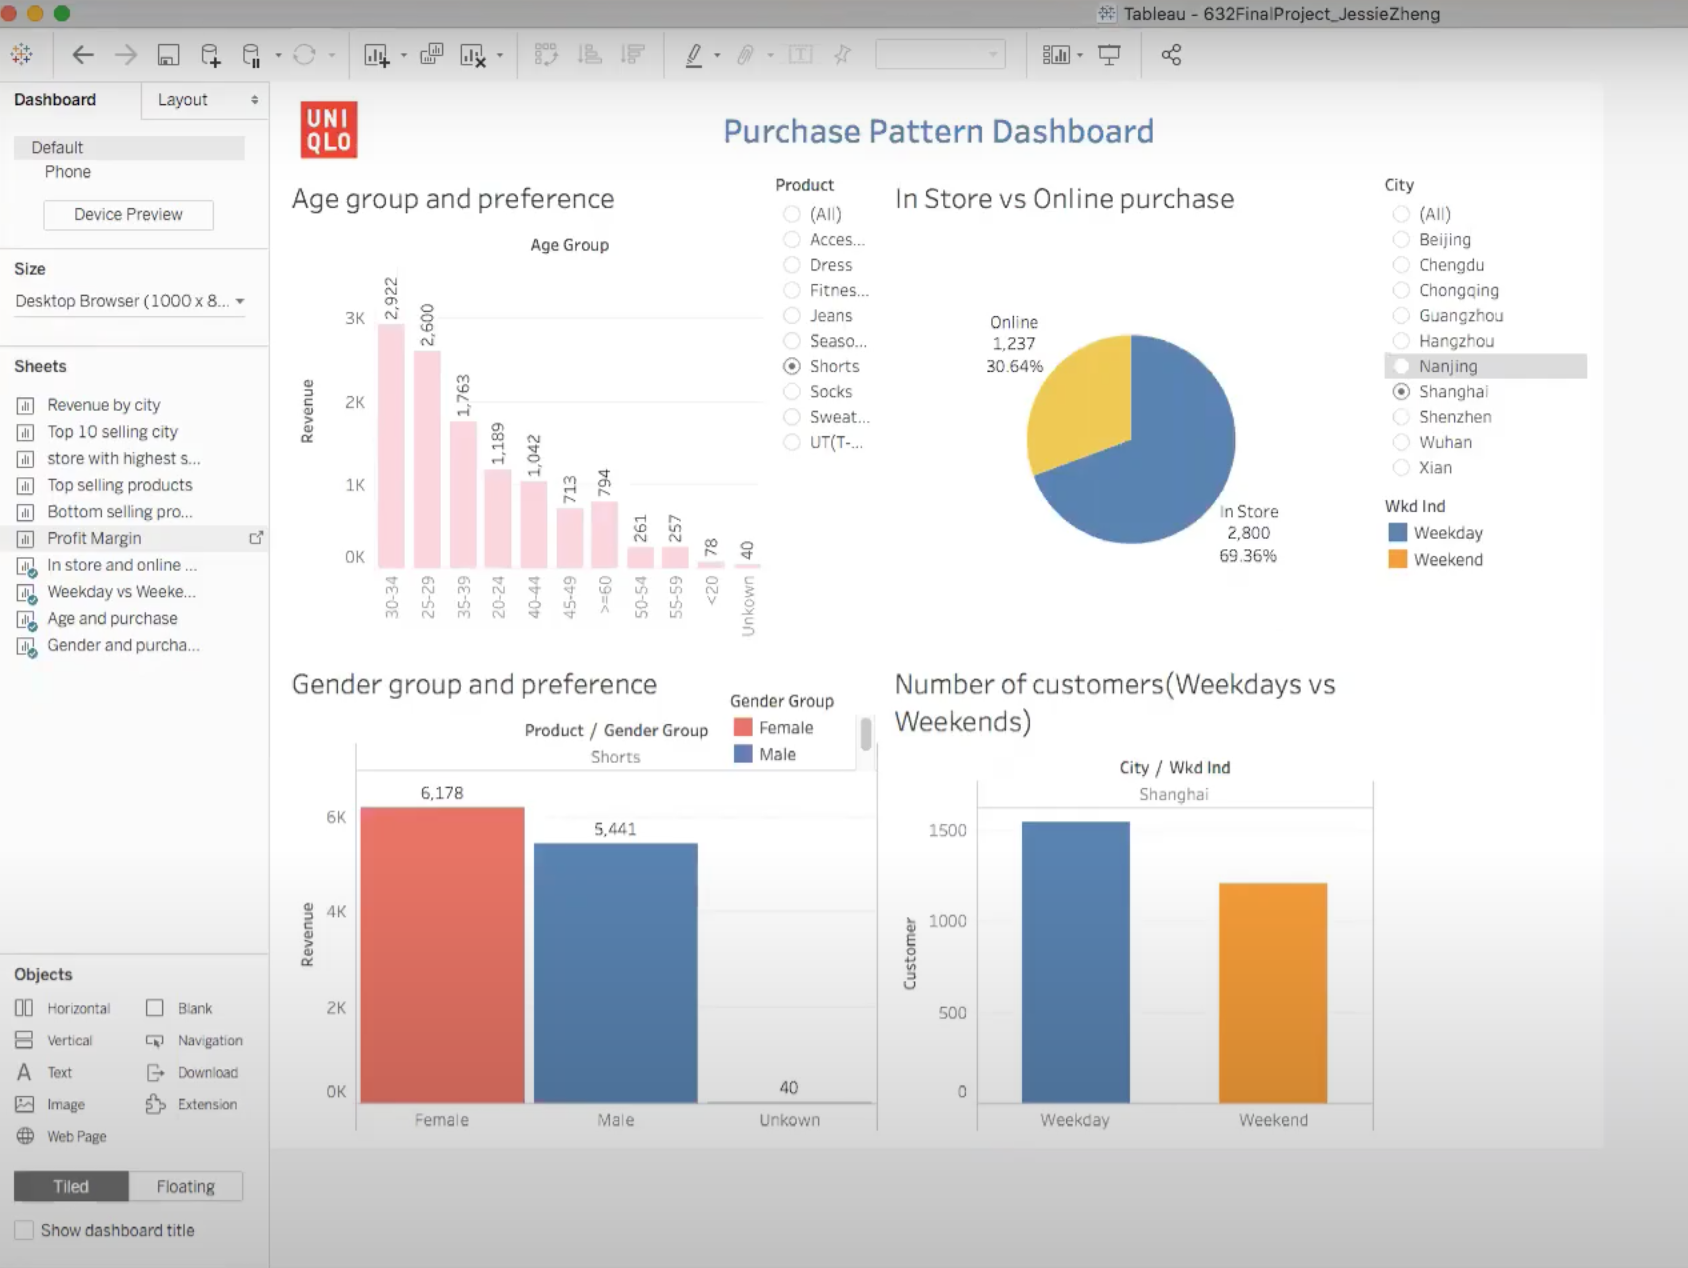 In this last dashboard, I want to visualize customer purchase pattern and target our customers better. I created 4 visualizations in this dashboard to show sales by age group, gender, weekdays/weekends and online purchase. This dashboard is also a interactive dashboard, where users can drill down to a specific filter.
Insight#
In terms of cities, the top 5 cities by sales are Shenzhen, Wuhan, Hangzhou, Shanghai, Guangzhou. Shanghai ranked 4th among all the cities. The average sales amount is 355643. There are 4 cities exceeds the average.
From the product perspective, the top selling products are t-shirts, seasonal new items, accessories, socks and shorts. The least selling products are dress, sweaters, fitness products, jeans and accessories. From the profit margin panel, socks (69%) have the highest profit margin, following by accessories (68.2%) and shorts (49%). Jeans (-0.19) have a negative profit margin, which indicates a loss of money
In terms of purchase pattern, more people prefer to purchase in store than online. In Shanghai, 69% of the customers paid in store compared to 30% customer purchase online. This data also showed that there were more customers purchased on weekdays than weekends. However, we don’t know the number of customers purchased on a specific day due to limitation of this dataset. In addition, females purchased more than male in every product. The 30-34 age group had the highest buying power compared to other groups.
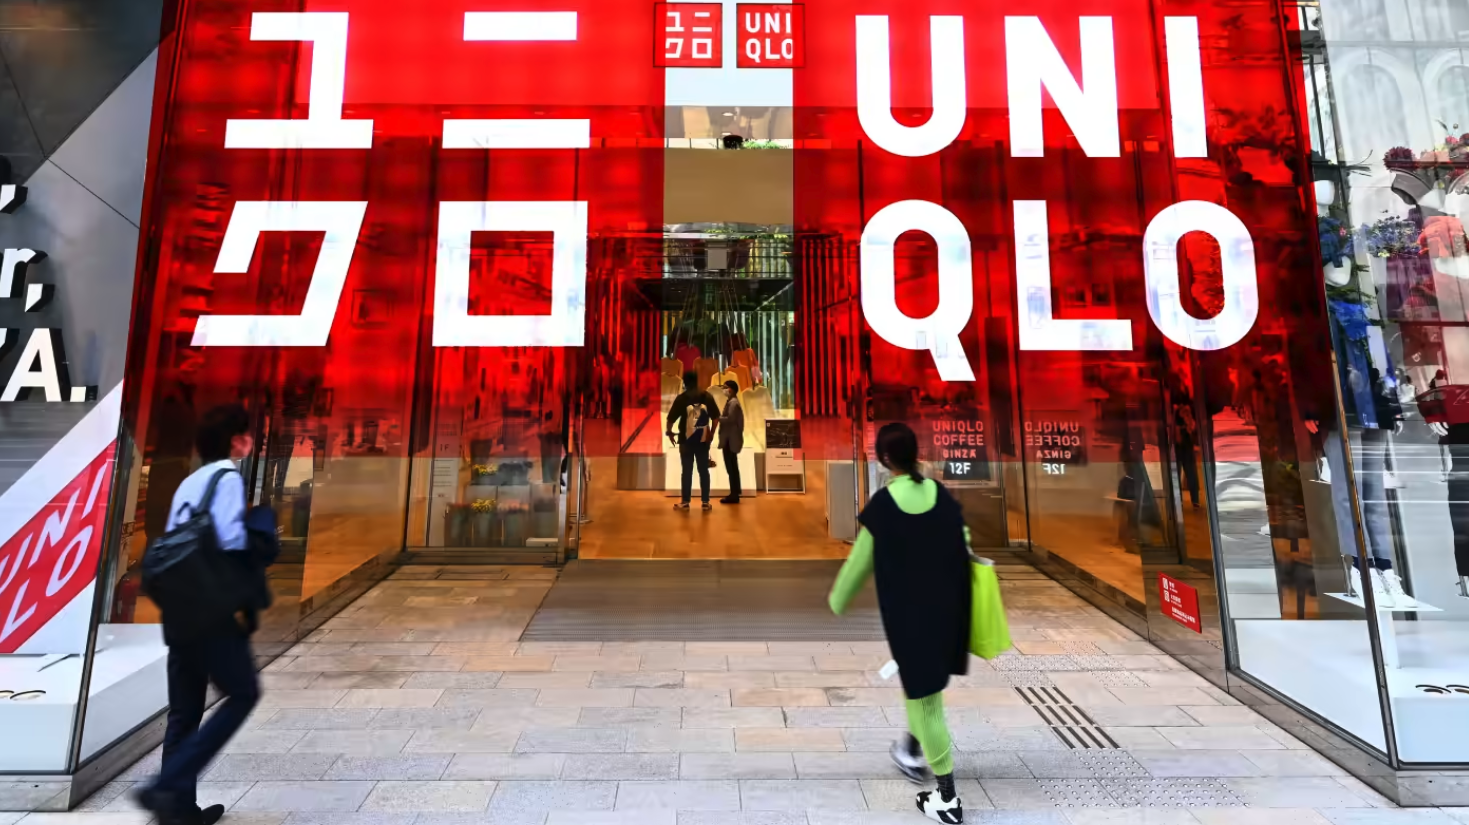 (Source photo by Shihoko Nakaoka)
To conclude, jeans and finesse products have low profit and low sell. Therefore, the stores should reduce the inventories on these two products. Socks and accessories had high profit but low sale. To maximize profit, each store can focus on promoting sales of socks and accessories.