What is decomposition in time series analysis?

Decomposition is primarily used in time series analysis. It involves thinking of a series in terms of level, trend, seasonality, and noise components. These four components are defined as follow:
🔎 Level: The average value in the series
🔎 Trend: The increasing or decreasing trend
🔎 Seasonality: The repeating cycle in terms of seasons
🔎 Noise: Random variation
Why it’s important to decompose?#
The time series decomposition helps with forecasting by breaking a time series down into different components – systematic and non-systematic components. It provides a structured way of thinking about a time series forecasting problem, in terms of modeling complexity and specifically how to capture each of these components in a given model. We need to think about each of the four components mentioned above, and address each one during data preparation, model selection and model tuning.
Additive vs. Multiplicative model: Additive model refers to the components are added together. An additive model is linear where changes over time are consistently made by the same amount. Y=seasonal components+ Trend+ remainder Multiplicative model suggests that the components are multiplied together. Unlike additive model, multiplicative model is non-linear, either exponential or quadratic. Changes increase or decrease over time. Y=seasonal components * Trend * Remainder
Example:#
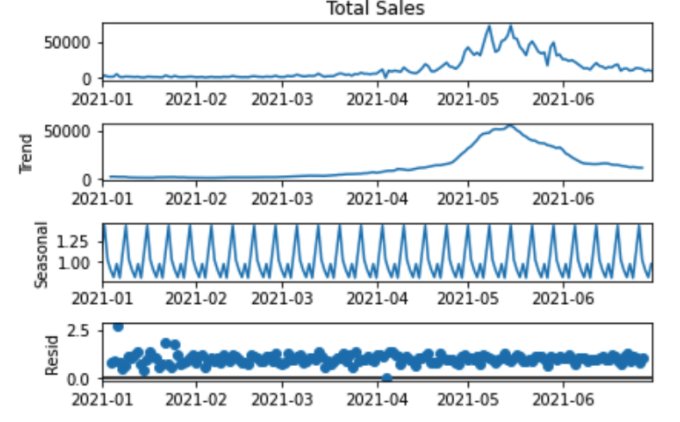
I used a fake sales data to demonstrate multiplicative composition. The additive decomposition method is more appropriate when the seasonal factors tend to be steady from one year to the next. However, multiplicative decomposition is more widely used when the time series has a seasonal factor that grows proportionately, such as sales of ice cream increase more during the summer. This dataset describes the total sales of a store during the first half year of 2021. We use the seasonal_decompose() function provided by the statsmodels lib. Running the code performs the decomposition and plots the 4 resulting series. We can see that the seasonality and trend information extracted from the series does seem reasonable.
from statsmodels.tsa.seasonal import seasonal_decompose
result2=seasonal_decompose(data5, model='additive')
print(result2.trend)
print(result2.seasonal)
result2.plot()

Conclusion#
Today, we learned decomposition in time series analysis, which can be used to inform forecasting models. The future post will explore more about decomposition and different techniques of time series analysis model and evaluation.
Reference:#
Introduction to Time Series Forecasting with Python: How to Prepare Data and Develop Models to Predict the Future (Jason Brownlee)