what is exploratory data analysis?

Understanding data is one of the most important steps for anyone starting out a machine learning project. Exploratory Data Analysis is one of the ways to do that. “EDA is performed in order to define and refine the selection of feature variables that will be used for machine learning”. This post briefly talks about EDA and Bivariate Analysis.
The post will cover:
What is EDA and Bivariate Analysis
Why it is important
EDA and feature Engineering
What is EDA?#
EDA stands for Exploratory Data Analysis. It is a crucial step to understand data. There are so many useful information that you can get from EDA:
💡Distribution(skewness)
💡Outliers(See the figure below)
💡Mean
💡Median
💡Correlation
💡etc;

Knowing about these are very important in terms of understanding our data. Just like the box plot shown below, because of there are a lot of outliers observed in the totChol column, the missing values were filled with median instead of mean.
Bivariate Analysis#
Additionally, I also utilized Bivariate Analysis in my project to understand the data. Bivariate analysis, just like its name, refers to analysis that help you understand association between two variables, usually with visualizations.
For example, I wanted to understand the association between prevalentStroke and whether the person will get heart disease. As shown below, people who have prevalent stroke is more likely to develop Heart Disease than people who don’t have prevalent stroke.
data[["prevalentStroke","TenYearCHD"]].groupby
("prevalentStroke", as_index=False).mean().sort_values("TenYearCHD")
Output:
| prevalentStroke | TenYearCHD |
|---|---|
| 1 | 0.440000 |
| 0 | 0.150178 |
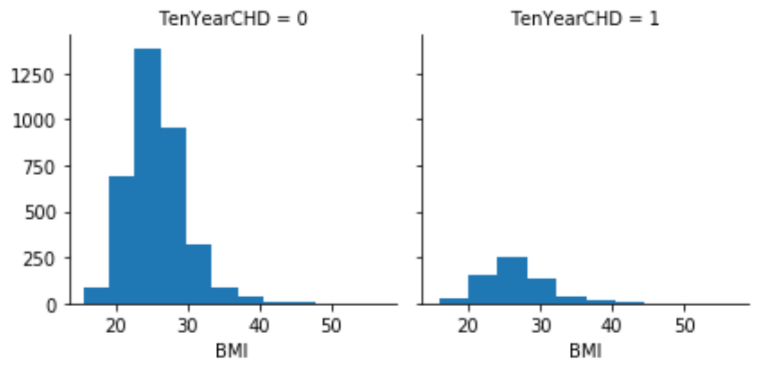
The reason that I used Bivariate Analysis was because I wanted to know the relationship between each category and the dependent variable(coronary heart disease). Second of all, I wanted to test our hypothesis, which states that people with bmi over 30 are more likely to develop heart disease. And the probability of getting heart disease within each BMI range, should be calculated as:
Number of people(BMI 20~30) that have CHD/Total number of people(BMI 20~30)
g=sns.FacetGrid(data, col="TenYearCHD")
g.map(plt.hist, "BMI)

Conclusion:#
In machine learning, it is beneficial to do EDA because it helps you to understand the data. After EDA, you can combine insights that you have got from the data, to feature engineering — to create or drop features. Therefore, EDA provide insights, feature engineering makes action on the data.
(Originally written on wix.com Apr 15 2020)