analyzing baby product purchase pattern with Excel

Introduction:#
Buying pattern refers to the characteristics way of customer’s buying in terms of product category, frequency, etc. It’s important for business to know customer’s buying pattern in order to make better marketing strategy to meet the need of their target consumers.
This post will analyze purchase pattern based on baby product dataset obtained from Tianchi, a sourcing company which hosts big data competitions in various industries.
Dataset Summary:#
This Mum_Baby dataset contains 952 baby’s information including user_id, birthday, gender which were provided by customers. The second dataset contains 29971 customer’s purchase history.
Purpose of this report: Analyzing customer’s buying pattern based on baby’s age, gender and product category.
Data Cleaning: By checking the two excel spreadsheets, I don’t recognize any missing values. However, by using conditional formatting, I identified 3 duplicate values in the customer’s data, thus, 3 records were removed.
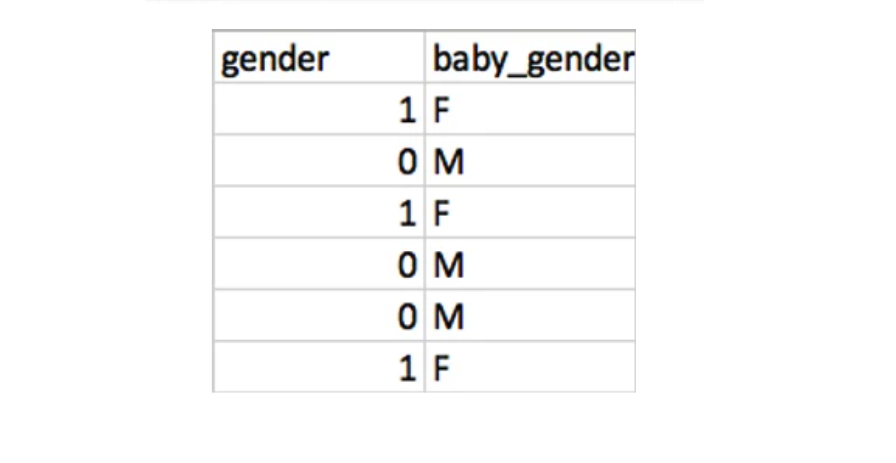
In order to make the spreadsheet more readable, I made small changes to the column gender by using SWITCH function:
<code>=SWITCH(C2, 1, "F", 0, "M", 2, "UNKNOWN")<CODE/>
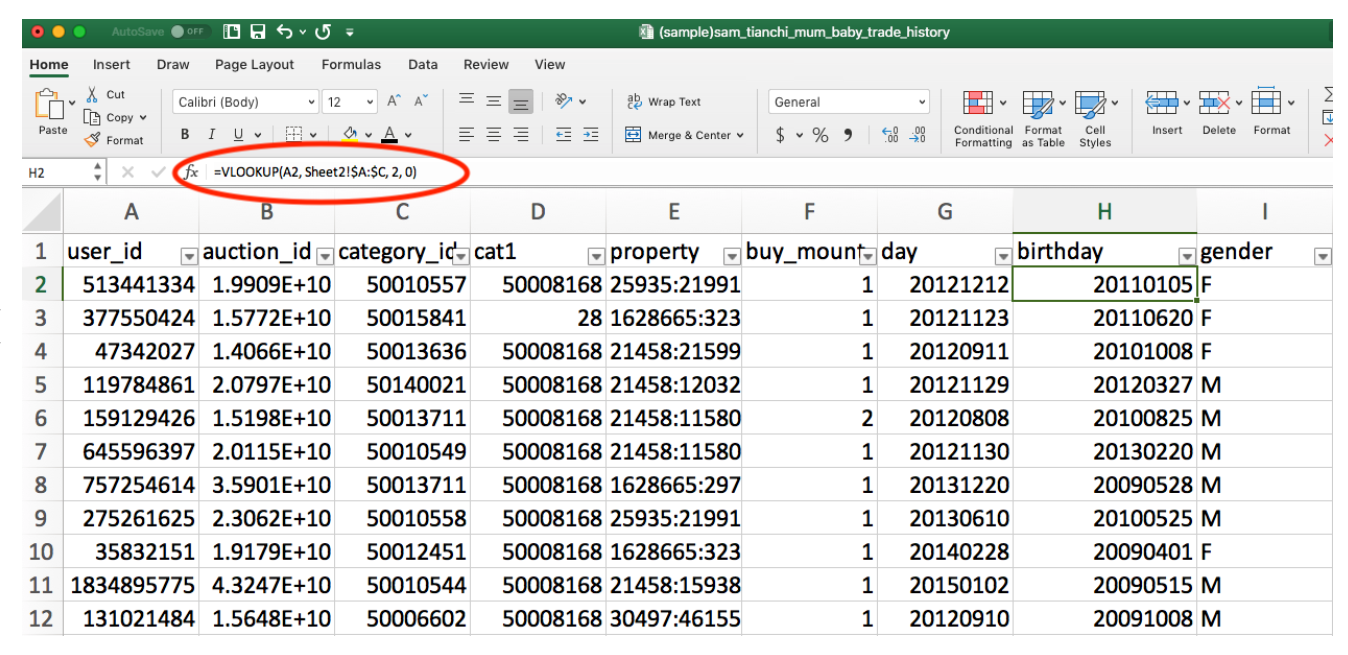
Since the purpose is analyzing the buying pattern by category, age and gender, I combined the two spreadsheets based on the key: user_id. Now, we can see that the baby’s information and product information are in the same sheet. After we combined, there were 952 records left.
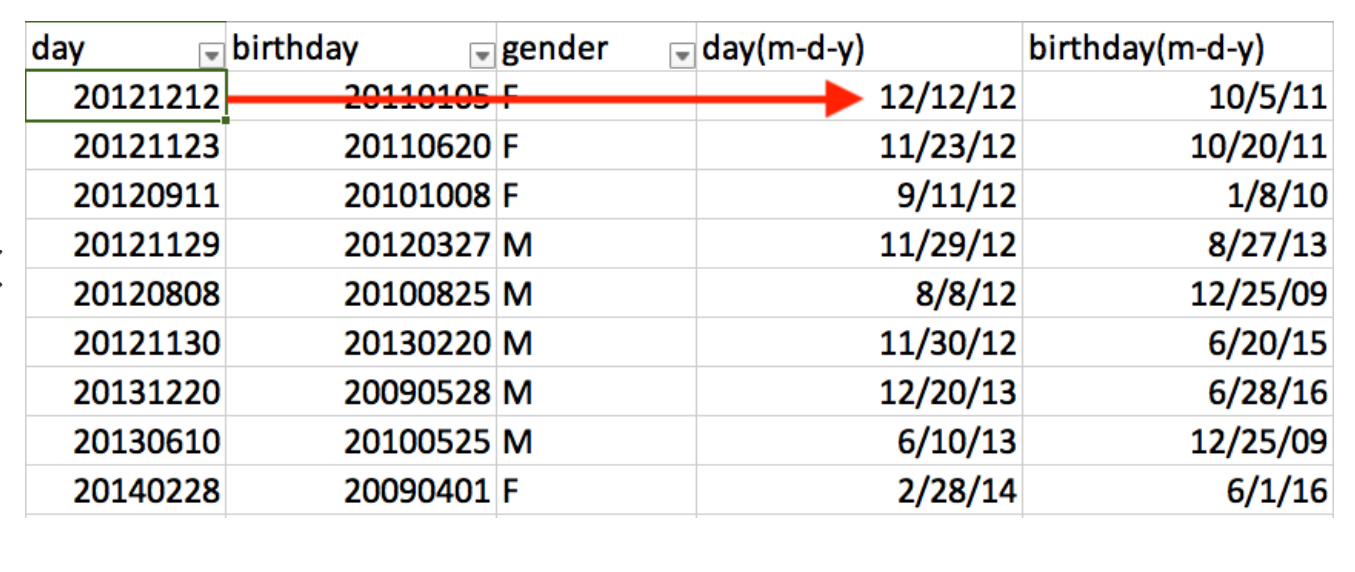
Next, I can see that the day and birthday are string instead of date value. By using the DATE() function, it can be transformed into date(month-date-year).
<code> =Date(LEFT(G2,4), MID(G2, 5, 2) RIGHT(G2,2))<code>
Since we are interested in buying pattern by baby’s age, I added a column to calculate baby’s age based on their birthdays, and also a “age range” column by using IF statement. After this step, we are ready to make some basic analysis.
<code> =FLOOR((J2-K2)/365*12,1)<code>

<code> =IF(L2<0, "UNBORN", IF(L2<12, "0 year old", IF(L2<24, "1 year old", IF(L2<36, "2 years old", IF(L2<48, "3 years old", "Over 3")))))<code/>

Report:#
1. Seasonal Sales Records in 2012-2015:
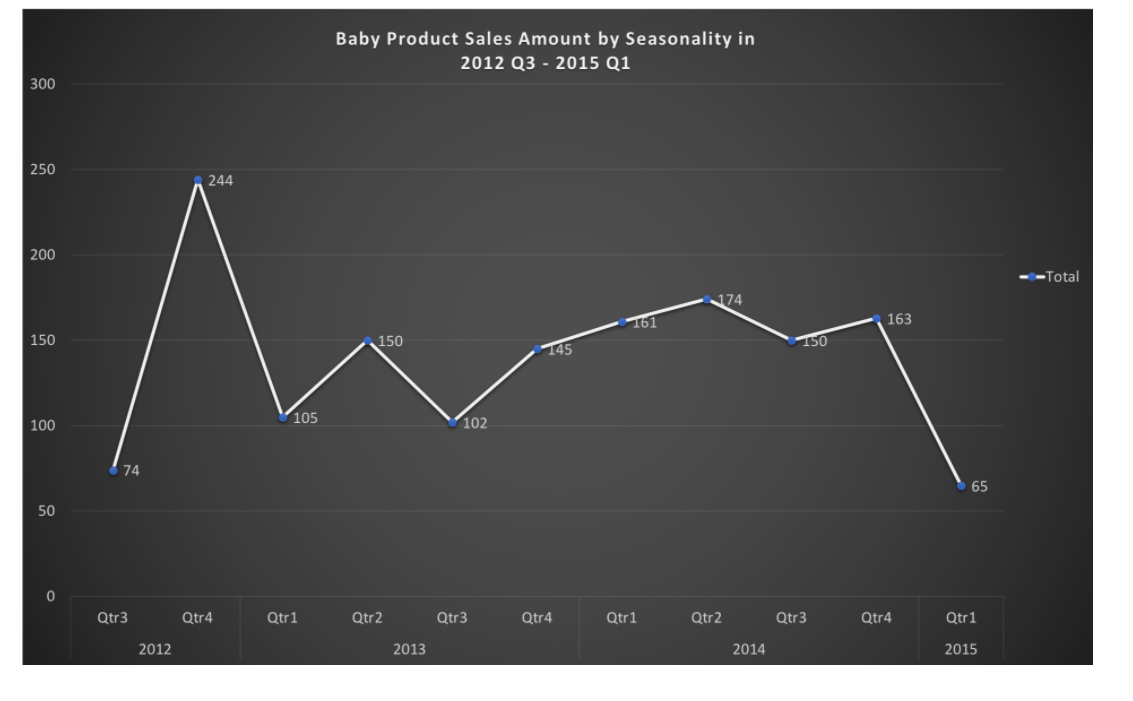
From the graph above, there were increasing sales amount between Q3 and Q4. During Q4 2012, it had the highest sales amount(244) compared to other years. The potential reason could be that during the holiday shop season, people would buy more stuff for themselves or shopping gifts for others. In additional to this, the Double 11 shopping festival (Nov 11) also motivates people to purchase more because of strong discount by a lot of retailers.
2. Sales by Product Category:
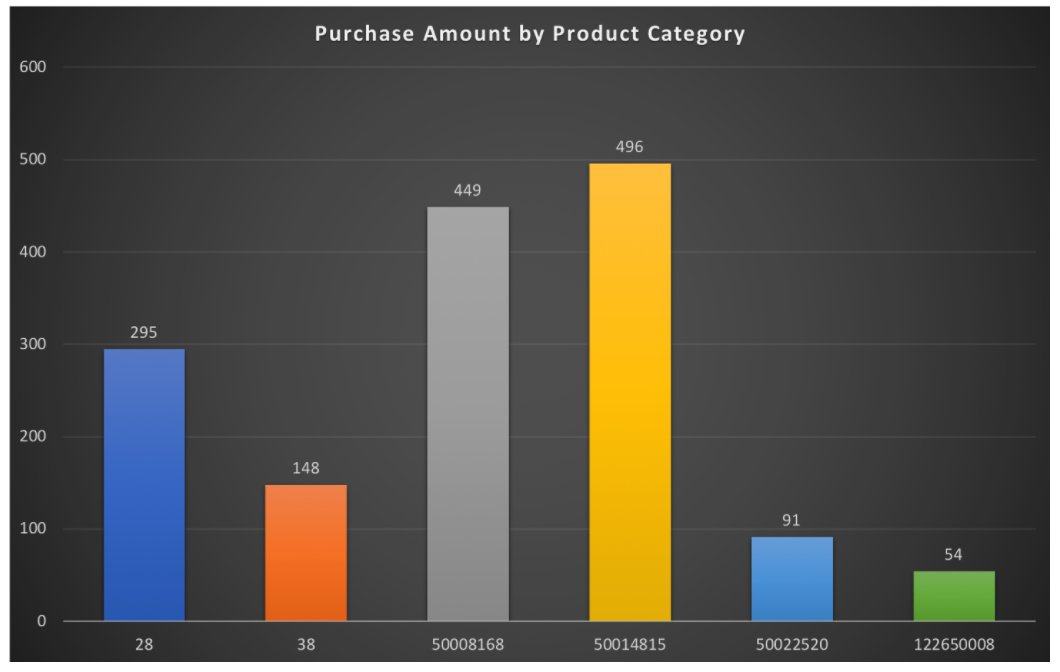
The bar chart above shows the sales by each product category. Due to limitation of the dataset, we don’t know the meaning behind those product category numbers. However, the graph shows that product “50014815” and “5008168” are the most popular products. Next, we can explore more about the sales in category by different seasons.
2.1 Seasonal Sales by Product Category
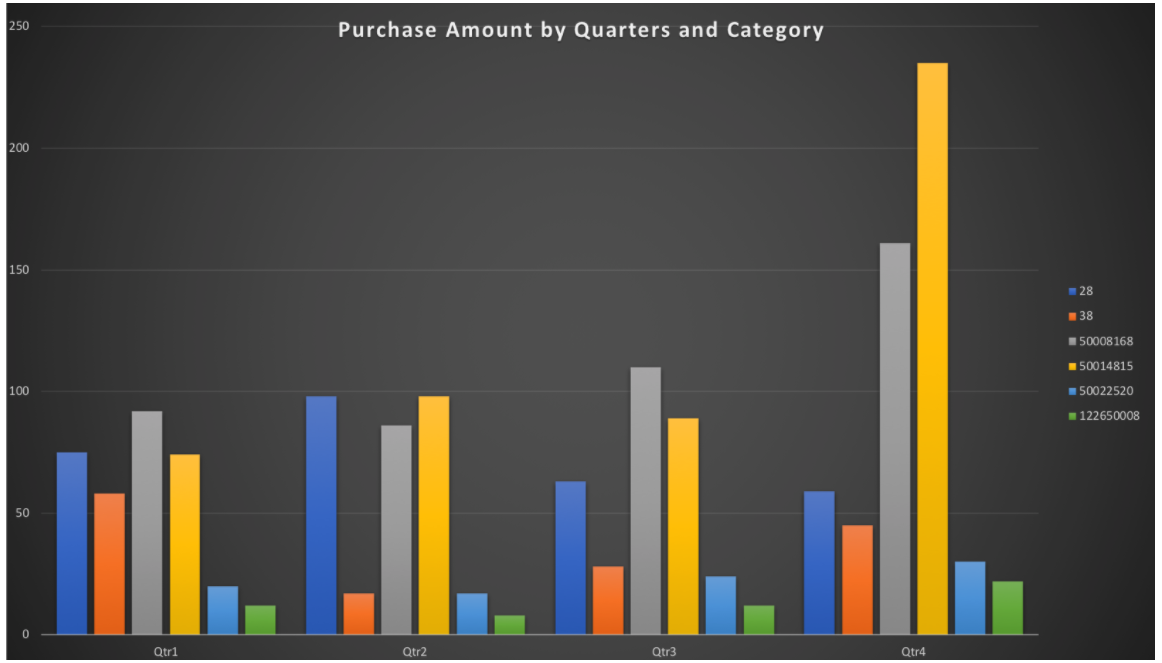
From the graph above, we learned that Q4 had higher sales in almost every category. For example, product “50014815” had double sales amount in Q4 compared to sales in same category in Q1, Q2 or Q3. Despite the reason of holiday sales and shopping festival, some product also had better sales in a particular season. For instance, product category 28 had highest sales in Q2 compared to any other quarters. Meanwhile, product category 38 had the highest sales in Q1. Therefore, we are able to see the seasonal product based on demand and purchase history.
3. Sales by Age
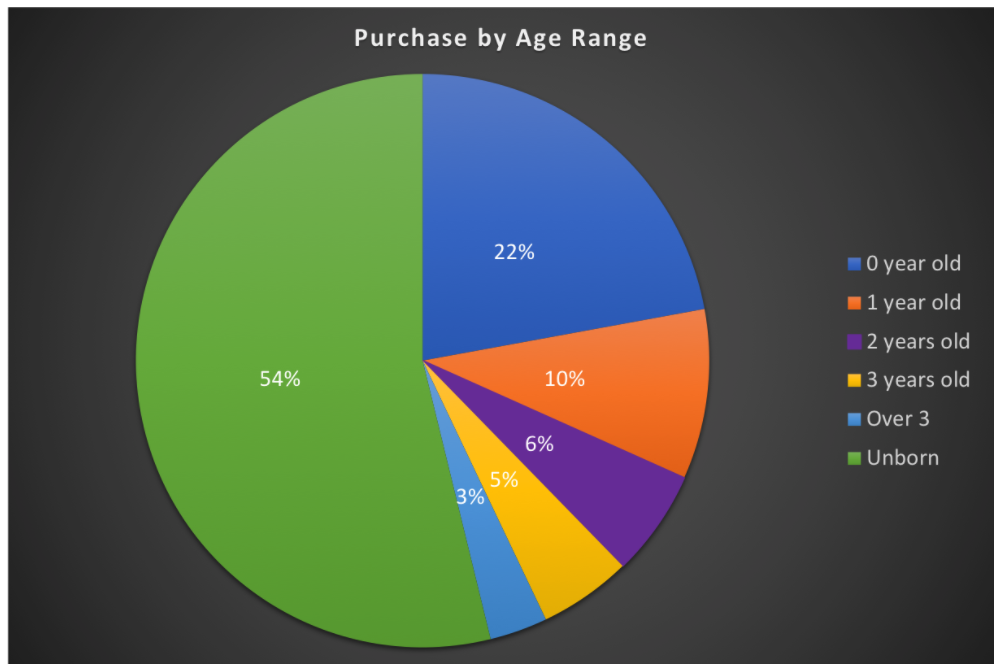
From the pie chart, we are able to see the purchase amount by baby’s age. The chart indicates that more than half (54%) of the purchases were made before the child was born, following by “0 year old” (22%) and “1 year old”(10%). By adding the number together, about 85% of the purchases were made when the baby was under 1 year old.
3.1 Sales by Age and Product Category:
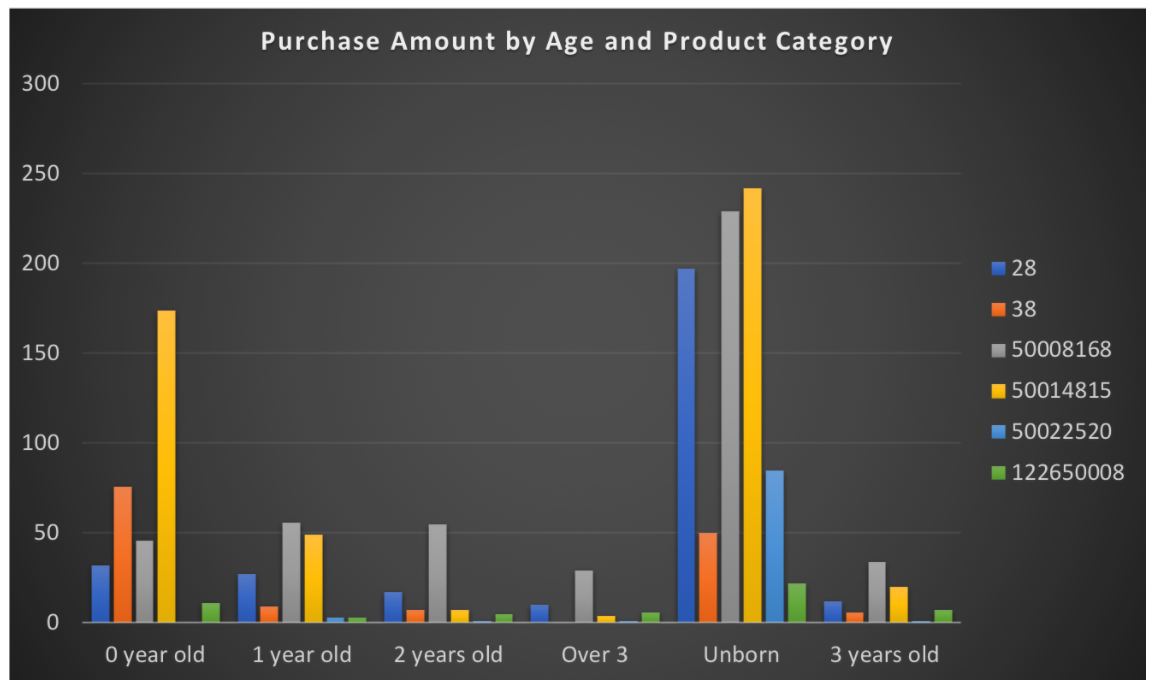
The bar chart above shows the sales in each category by baby’s age. Before the babies were born, caregivers tended to purchase more in almost every product category. After the child was born, some of the categories kept high demand, for example product category “50014815” and “38”, while some product category demands decreased, such as product “50022520”.
4. Sales by Gender
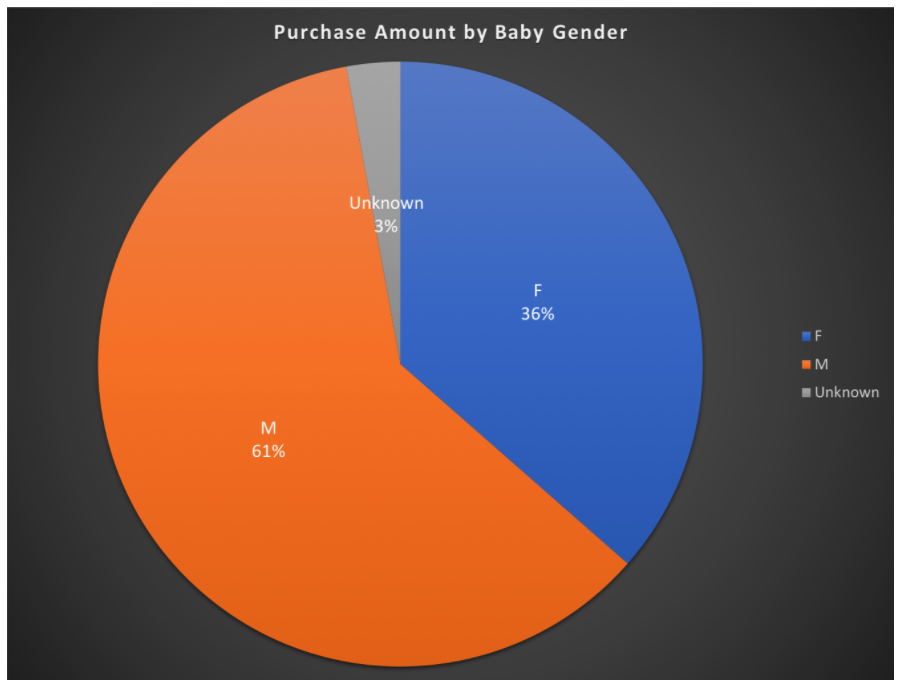 The dataset contains 490 male records versus 439 female records. Despite the small difference between the gender, caregivers tended to purchase more for male than female.
4.1 Sales by Category and Gender
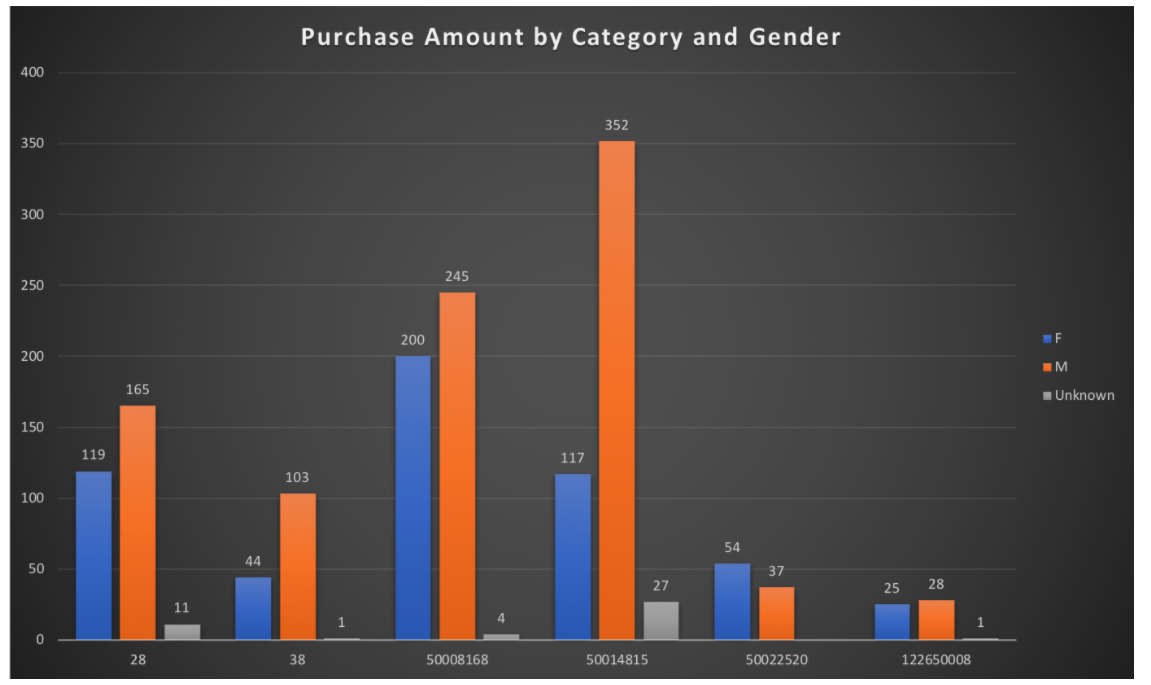
In order to learn more about purchase pattern by baby’s gender, the bar char above was made to show the purchase pattern by gender and category. There were more purchases made by male baby’s caregivers than female baby’s among 5 out of 6 of the categories. For product category “50014815”, boy’s caregivers purchased 3 time as much as girl’s caregivers. However, some of the products had the same sales despite the gender, such as product “50022520” and “122650008”.
Conclusion:#
There were increasing sales during Q3 and Q4 due to holiday discount and shopping festivals.
Products category(such as 28, 38) had higher sales in a particular season, therefore, they are very likely to be seasonal products.
Infants (under 1 year old) caregivers tended to purchase and contributed to most of the sales. Among all the products, product category “50014815” and “28” had higher demand in infant group. Other product categories are unlikely influenced by baby’s age.
There are clearly demand difference based on baby’s gender. Male baby’s caregivers bought 3 times more products in category “500114815” compared to female baby, and thus, it is likely to be a gendered product. Other product categories are unlikely influenced by baby’s gender.